Finding the Longest Cold-Snap
Here’s a simple programming question:
Given a time-series of temperature measurements, what is the longest continuous sequence of days during which the temperature was below freezing?
Pretty straightforward, right? It’s the type of question you might expect to see during a technical interview or a first-year lesson on how arrays work. My motivation for discussing this goes deeper, however.
I first encountered a modified version of this problem during an internship between my third and fourth year studying Computer Engineering. While I came up with a fairly obvious solution using an imperative language, it was clunky because I had to unload the data from a database, find these rule-based sub-sequences of adjacent rows, and load the result back into a database. I was (mildly) haunted by the idea of answering this in pure SQL, with no need to drag the data out and into a database.
In this article, I want to discuss three solutions to this question: the “obvious” solution and two declarative solutions written in SQL (one portable, one less-so). Because this pattern has served me well in Python, I will also present the first declarative solution in Pandas. I certainly benefited from developing these pattern extraction “recipes”, since different versions of the problem have come up over and over in my day-to-day work.
Finally, if you need even more motivation to find this interesting, I know that at least one FAANG company has used a modified version of this question in its technical interviews. If you’re looking for a job at one of these companies and have never thought about this before, I would encourage you to take 10-15 minutes to think about a solution and to write some code before continuing with the article. Experience is the best teacher, after all.
Now, let’s dive in.
The Leetcode Solution
If the original question is posed in a coding interview, and you are expected to produce an answer which demonstrates a basic level of programming competency, you might come up with a solution that uses this “LeetCode” approach. Let’s first visualize our dataset:
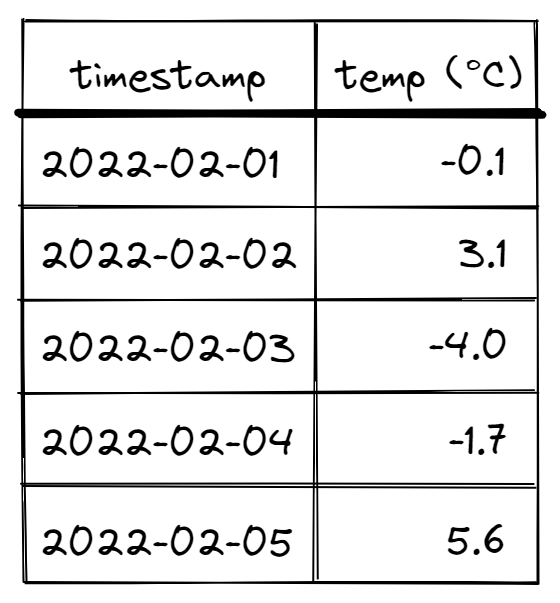
What we have is a sequence of dates and temperatures, and what we are trying to find is sub-sequences of consecutive dates, all of which are below freezing. One approach might be to go through this data one by one and keep track of these sequences as we find them. Then, all we have to do is keep track of the length of the longest sequence we’ve seen, and its associated beginning/end dates. Here’s some Python code that does exactly this:
from datetime import datetime
def find_longest_freezing_sequence(
    timestamps: list[datetime],
    temps: list[float]
) -> int:
	"""Find the longest sequence of freezing days"""
	longest_seq_length = 0
	current_seq_begin = None
	current_seq_length = 0

	# Search for the longest sequence
	for timestamp, temp in zip(timestamps, temps):
		# Check today's temperature and add to the current sequence
		if temp < 0.:
    		# Initialize beginning of the current sequence
			if current_seq_begin is None:
				current_seq_begin = timestamp
				current_seq_length = 0

			# +1 because of the current day...
			current_seq_length = 1 + (timestamp - current_seq_begin).days

		# Reset current sequence if temp is above 0C
		else:
			current_seq_begin = None
			current_seq_length = 0

		# Compare current sequence to longest sequence and update accordingly
		if current_seq_length > longest_seq_length:
			longest_seq_length = current_seq_length

	return longest_seq_length
This code is simple to understand, easy to debug, and demonstrates to the interviewer that you know how to program. Extending this code to find all such occurrences and their lengths involves keeping track of some growing lists, but most modern programming languages can optimize for this without too much overhead (see Golang’s growing slices).
Pros:
- Easy to understand
- Easy to debug
- Constant additional memory usage (only 3 variables)
- Only one iteration through the list, and thus \(O(n)\) runtime complexity
Cons:
- More work to answer follow-ups
- Not resilient to dataset problems or modifications:
- If the data isn’t sorted, you need to be comfortable with some more obscure Python features of
sortedorsort. See docs about sorted, specifically thekeyargument. - If there are multiple assets, you need to be comfortable with
itertools.groupby, or modify the way you sort your data above.
- If the data isn’t sorted, you need to be comfortable with some more obscure Python features of
- Relatively slow (because pure Python is slow)
- Not very easy to parallelize
Now for the main event: declarative approaches.
The Clever Solution
This is a declarative solution that I came up that is “clever” in the sense that it’s a little more difficult to understand at first glance. The basic idea is to generate some sort of identifier for each group of consecutive freezing days, do a “group by” on that identifier, and compute basic statistics about the groups. In a declarative programming environment, generating the unique indices for sub-sequences is the “clever” part that I will explain. But first, some code:
import pandas as pd

data_df = pd.DataFrame(dataset) # Assume sorted

# ??? The Magic Line ???
data_df['group_id'] = (data_df['temp'] > 0).cumsum()

# Group and aggregate
groups_df = (
	data_df[data_df['temp'] < 0]
		.groupby('group_id')
		.agg(
			num_days = ('date', lambda x: (x.max() - x.min()).days),
			begin_date = ('date', 'min'),
			end_date = ('date', 'max')
		)
)
What’s going on here, and how does the “magic line” generate our group IDs? First, let’s add an additional column freezing? to our dataset indicating if it is freezing.
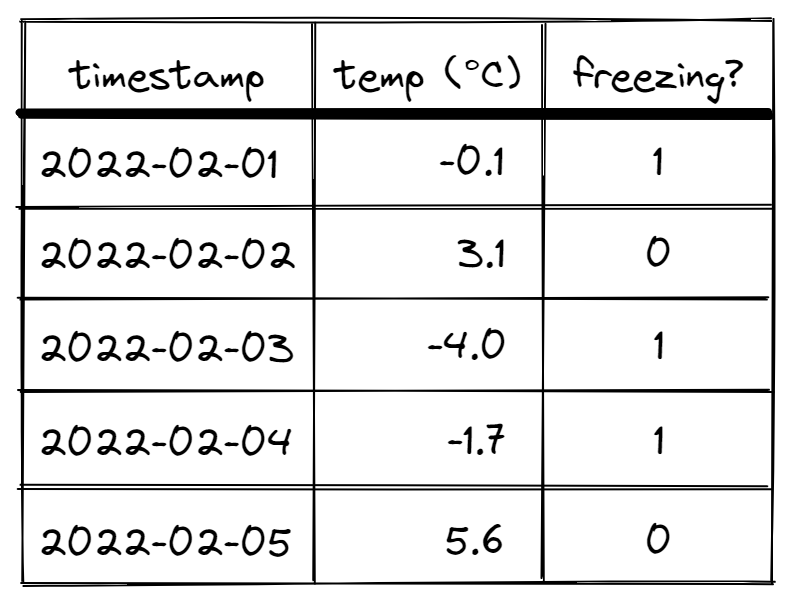
We can spot clusters of consecutive 1’s visually that we’d like to associate with one-another. More precisely, two rows are part of the same sub-sequence of “freezing days” if both adjacent rows contain 1’s in the freezing? column. Note that the “LeetCode” solution above essentially iterates through the data and generates these values on-the-fly while we are generating them all ahead of time.
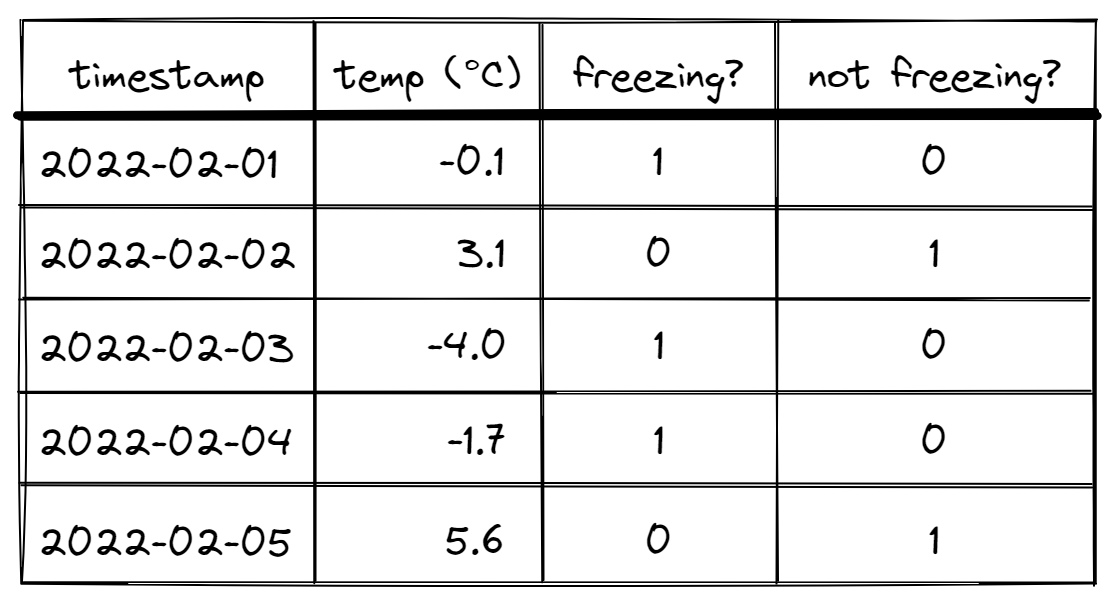
So how does the above code generate these identifiers? Consider the negation of the freezing? column (not freezing? in this case)
If we do a cumulative sum over this column (time-sorted), something interesting happens.
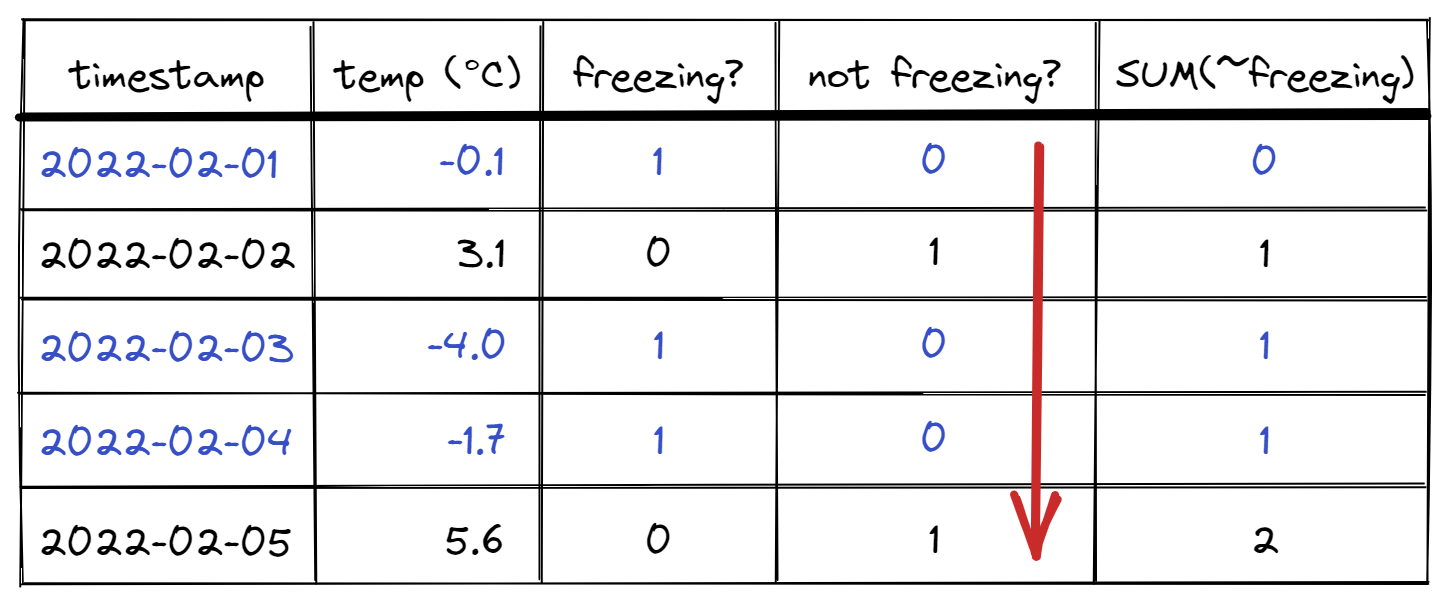
For each freezing row, the not freezing column does not update the running sum (since not freezing? = 0 for that row). Thus, the running total stays the same for all rows in that sub-sequence of consecutive freezing rows. However, at the next non-freezing row, the running total updates because not freezing? = 1! So future sub-sequence indices will be greater than prior ones by at least 1. We have concisely generated a unique identifier for each sub-sequence of rows that are freezing.
In the final step, we keep only freezing? rows, group by the unique identifier we calculated, and compute any metrics we would like (length of sequence in time, min/max/median temperature values). And just like that, we have found all sequences of consecutive freezing days; now we just have to take the maximum length.
That sounds great, but how do we do this in SQL? The answer is with window functions. Window functions essentially allow us to partition our data into ordered subsets of rows called “windows” and perform computations row-by-row on the contents of both that row and the window it lives in. Mathematically stated, we define a window \(W\) with ordered contents based on some partitioning criteria and a row \(r_i\) in \(W\), giving us a function roughly of the form:
\[ \begin{align} v_i &= f(r_i, W)\\ &= f(\dots, r_{i-2}, r_{i-1}, r_i, r_{i+1}, r_{i+2}, \dots) \end{align} \]
where \(v_i\) is the value of our window function. In particular, this allows us to compute the cumulative sum at row \(r_i\):
\[ v_i = \sum_{k=0}^i r_k = r_1 + r_2 + \cdots + r_i \]
with respect to time as above. Here is the SQL code:
with dataset as (
	select meas_ts, temp
	from underlying_data
)

-- The magic part here
, get_group_id as (
	select meas_ts, temp,
		sum(to_numeric(temp > 0)) over (order by meas_ts) as group_id
	from dataset
)

-- Grouping and computing metrics
select group_id,
	min(meas_ts) as begin_date,
	max(meas_ts) as end_date,
	datediff(day, begin_date, end_date) + 1 as num_days_freezing
from get_group_id
where temp < 0
group by group_id
order by num_days_freezing desc
If we have multiple devices/assets giving us temperature data, we can modify the window function to be:
sum(to_numeric(temp > 0))
    over (partition by device_id order by meas_ts)
as group_id
and group by device_id and group_id.
The general recipe seems to be:
- Compute the negation of your condition
- Cumulative sum over the condition-negation to produce unique identifiers
- Filter out rows that fail to meet the condition
- Group by the previously-calculated unique identifier and compute metrics to your hearts desire
Pros:
- Flexibility to quickly answer follow-up questions
- You get all freezing sub-sequences for free.
- It’s easy to extend to multiple assets with
PARTITION BY.
- Resilient to dataset problems
- You can kick out sequences with time-gaps that are too long by using either the
LAGorLEADwindow functions in SQL, or.shift()in Pandas.
- You can kick out sequences with time-gaps that are too long by using either the
- Very fast in both environments, especially with large amounts of data
- Easily parallelized (the Pandas code is supported by Dask as well as Pandas on Pyspark, and any most databases will parallelize the SQL code under the hood)
- No additional dependencies
Cons:
- It’s harder to understand and debug
- The code can get unwieldy if the matching criteria is too complicated
Other people won’t be as excited about this as you are
Finally, for the right person/environment, we have what I think is the best solution (if available).
The Right Solution (If your database supports it)
The “correct” solution is to use the MATCH_RECOGNIZE expression in SQL if your database supports it. It was built for this exact type of task, and it implements a simplified form of Regular Expressions for rows of data (instead of characters in text). Let me briefly demonstrate:
with dataset as (
	select meas_ts, temp
	from underlying_table
)

select group_id,
	begin_date,
	end_date,
	datediff(day, begin_date, end_date) as num_days_freezing
from dataset
	match_recognize(
		--partition by device_id -- if applicable
		order by meas_ts
		measures
			match_number() as group_id,
			first(meas_ts) as begin_date,
			last(meas_ts) as end_date,
		pattern (freezing_day+)
		define
			freezing_day as temp < 0
	)

-- Optionally sort and/or limit by 1 to get a scalar answer
order by num_days_freezing desc
In the above, we define the symbol freezing_day as days when it’s, well… Freezing. Then the critical part:
pattern (freezing_day+)
tells the MATCH_RECOGNIZE expression to match 1 or more day(s) of freezing temperatures in sequence. This is exactly the same type of syntax as regular expressions. Also as a note, the match is greedy by default, i.e. it matches the longest sequence of rows that fit the pattern, which is what we want. Snowflake has a fantastic tutorial for using this syntax, so I’ll spare the other details of the expression.
Dealing with dataset problems such as unacceptable time-gaps is easy with window functions such as LAG, LEAD, FIRST, and LAST in the define or measures clause. Similar functionality in Python built on top of Pandas appears to be provided by the data patterns library, although I haven’t worked with that one directly.
Pros:
- Literally built for the task
- More easily accommodate dataset problems
- Very fast with a ton of data
- Highly parallelizable (at least in Snowflake)
Cons:
- Not supported by most databases (sadly, duckdb doesn’t support this yet)
Conclusion
So far, we’ve seen 3 flavors of rule-based pattern matching based on an interdependence between rows of data in an ordered sequence. This problem has come up a surprising amount in working with time-series data in my full-time job. Finding an elegant solution in SQL and Pandas with no external dependencies has been a game-changer for delivering these types of results to people who want them. This problem comes up in GPS movement data analysis in particular when trying to group observations of points in a time-series together in some meaningful way.
The larger topic of pattern matching is much more broad, and comes up in the parsing stage of compilers, and a lot of stream processing services. Note that it is distinctly different from pattern recognition, in which the task is to learn statistically significant patterns in a dataset without any prior rules for defining those patterns. Pattern recognition is also very relevant in my profession, as demonstrated by Bishop’s Pattern Recognition and Machine Learning, one of the go-to texts in machine learning today.